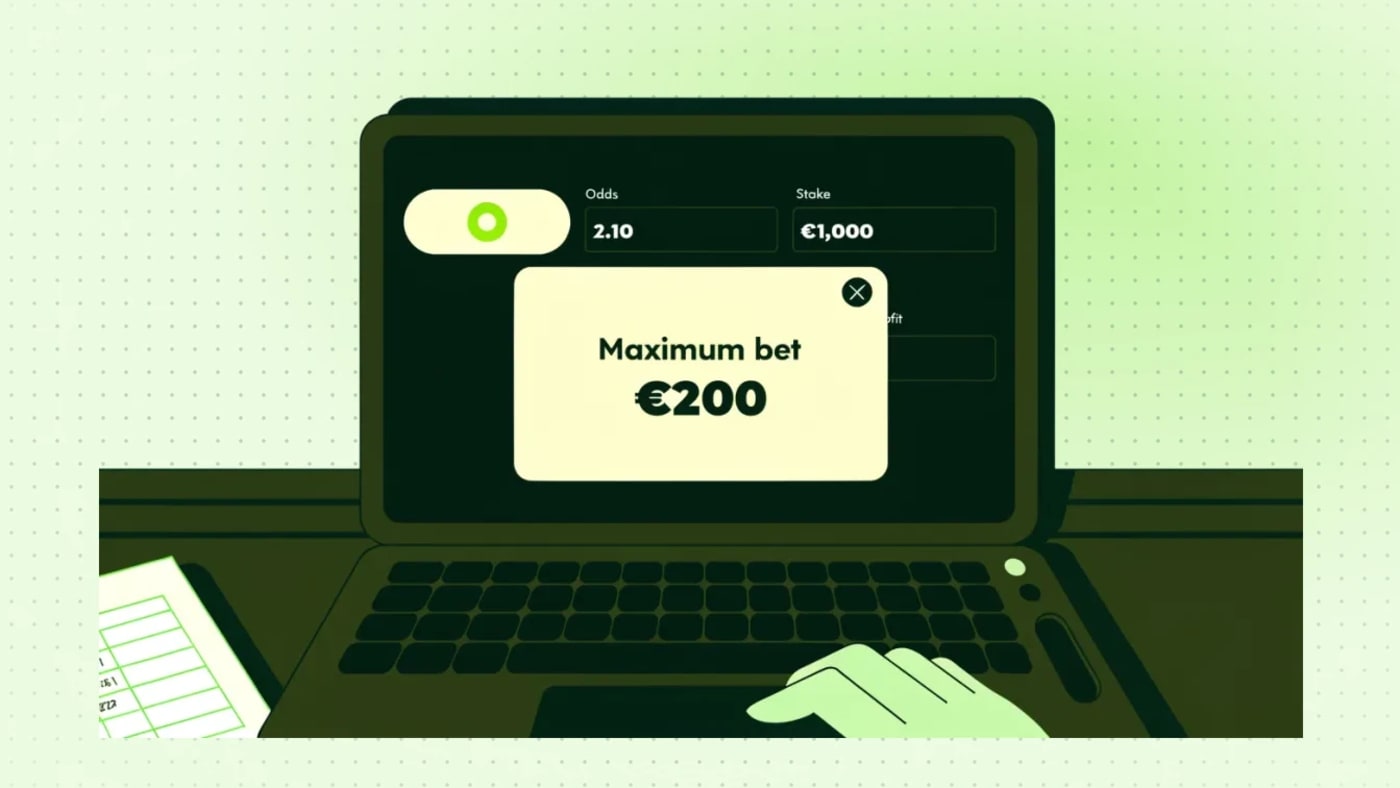
Introduction
In sports betting, many bettors believe that once they have found a profitable strategy, they simply need to increase their stakes progressively to generate larger profits.
On paper, the reasoning seems perfectly logical.
If a strategy generates a 5% ROI with €50 stakes, why not increase those stakes to €500, €1,000, or even €10,000?
Profits would theoretically increase by a factor of 10, 20, or 200.
Unfortunately, the reality of sports betting markets is much more complex.
Contrary to what many bettors believe, a strategy that is profitable with a small bankroll will not necessarily remain equally profitable with a much larger bankroll.
The main reason can be summarized in one word: liquidity.
Every market has a limited capacity to absorb stakes. Every bookmaker imposes maximum bet limits. Every betting opportunity can disappear when too much money is placed on the same selection.
This is why professional sports bettors do not simply analyze a strategy's ROI.
They also seek to answer a fundamental question:
How much money can actually be invested in this strategy without reducing its profitability?
In this article, we will explore why liquidity is one of the fundamental pillars of sports betting investment, how it influences bankroll management, and why it is essential when evaluating the investment capacity of a Tipster or an algorithmic betting strategy.
1. What Is Liquidity in Sports Betting?
Liquidity refers to a market's ability to absorb stakes without causing significant changes in betting conditions, particularly odds.
The more liquid a market is, the easier it generally is to place larger stakes while maintaining competitive odds.
Conversely, a market with limited liquidity may only be able to absorb relatively small amounts before betting conditions change.
Consider two examples.
A Premier League match between Arsenal and Liverpool generally attracts significant international betting activity.
Bookmakers receive substantial stakes, information is exchanged continuously, and thousands of bettors monitor the available markets.
In contrast, a third-division football match in a smaller country may attract considerably less betting activity.
The amounts accepted by bookmakers may therefore be much lower.
This difference can have significant consequences for professional bettors.
A profitable strategy operating in highly liquid markets may accommodate a substantial bankroll.
An equally profitable strategy operating in low-liquidity markets may quickly reach its investment capacity.
2. Why Is Liquidity Essential to Bankroll Management?
Let us return to our reference example.
Bankroll: €5,000
1U: €50
Stake per bet: 1% of the initial bankroll
Suppose our strategy generates a 5% ROI after 2,000 bets.
Total betting turnover is:
2,000 × €50 = €100,000
The profit is:
€100,000 × 5% = €5,000
Our initial bankroll has therefore generated a profit equivalent to 100% of its original value.
Now imagine that we have a bankroll of €100,000.
By maintaining a 1% stake, our betting unit would become:
€1,000
With the same 2,000 bets and the same 5% ROI, theoretical profit would be:
2,000 × €1,000 × 5% = €100,000
However, this projection relies on a fundamental assumption.
We would need to place all 2,000 bets at €1,000, obtain the same odds, and maintain the strategy's statistical edge under comparable execution conditions.
That assumption is not always realistic.
Bankroll size alone does not determine how much money can be invested. Market liquidity also determines investment capacity.
3. Liquidity, Maximum Bet Limits, and Market Volume: Three Different Concepts
These three concepts are often confused.
However, they do not mean exactly the same thing.
Liquidity
A market's ability to absorb stakes while maintaining relatively stable betting prices.
Maximum bet limit
The maximum amount a bookmaker is willing to accept on a particular selection at a given moment, subject to the conditions applicable to the bettor's account.
Market volume
The total amount wagered on a market during a given period, when this information is available.
A market may have attracted substantial betting volume throughout the day without allowing a bettor to place a very large stake immediately at the desired odds.
Similarly, a high maximum bet limit does not guarantee that hundreds of bettors will all obtain the same price.
| Indicator | Meaning |
|---|---|
| Liquidity | The market's ability to absorb stakes |
| Maximum bet limit | Maximum stake accepted on a selection |
| Market volume | Total amount wagered on a market |
| Market depth | Capacity available at different price levels |
At a bookmaker such as Pinnacle, maximum bet limits provide a particularly useful indication of execution capacity.
However, they should not be confused with the total liquidity available across the entire global betting market.
4. Why Are Some Sports Betting Markets More Liquid Than Others?
Liquidity varies considerably depending on several factors.
The sport
Football (soccer), basketball, and tennis generally attract significant betting activity in their major competitions.
Other sports may have much smaller betting markets.
The league
A Premier League, Champions League, NBA, or NFL game generally attracts more betting capital than a game in a minor competition.
The betting market
Main markets, such as moneylines, Asian handicaps, point spreads, and totals, may offer greater betting capacity than certain secondary markets.
The timing of the bet
Maximum bet limits at market opening are often different from those available shortly before the event begins.
The importance of the event
A FIFA World Cup final or a Super Bowl does not have the same market characteristics as a friendly match between lower-division teams.
Liquidity is therefore not a fixed characteristic of a sport or league.
It depends on the specific betting market and the time at which the bet is placed.
5. Differences in Liquidity Across Leagues
Consider the example of football.
Certain competitions benefit from substantial international exposure.
These include the English Premier League, Spain's La Liga, Germany's Bundesliga, Italy's Serie A, and the UEFA Champions League.
Other leagues have less developed betting markets.
This does not necessarily make them less attractive to professional bettors.
On the contrary, some smaller markets may contain greater inefficiencies.
However, their investment capacity is often more limited.
| Type of competition | Typical liquidity | Potential investment capacity |
|---|---|---|
| Major international competitions | Very high | Substantial |
| Major European leagues | High | Substantial |
| Mid-tier domestic leagues | Variable | Moderate |
| Lower divisions | Often lower | Limited |
| Niche competitions | Highly variable | Sometimes very limited |
This table illustrates general market tendencies rather than an official ranking of Pinnacle's maximum bet limits.
A secondary market in a major competition may sometimes be less liquid than a main market in a less prominent league.
6. Why Do Maximum Bet Limits Change at Pinnacle?
At Pinnacle, maximum bet limits are not necessarily identical throughout the life of a betting market.
When a market opens, the bookmaker has its initial probability estimates.
Available information may still change.
Starting lineups may not yet be confirmed.
Early bets from professional bettors may also contribute to adjustments in the odds.
As the event approaches, the market may become more mature.
More information becomes available.
Prices have been adjusted.
Maximum bet limits may consequently increase.
Consider the following illustrative example.
| Time of bet | Maximum bet limit |
|---|---|
| Market opening | €500 |
| 48 hours before the event | €1,000 |
| 24 hours before the event | €3,000 |
| 6 hours before the event | €5,000 |
| 1 hour before the event | €10,000 |
These amounts do not represent an official Pinnacle limit schedule.
They simply illustrate how betting capacity may evolve over time.
For a professional bettor, execution timing therefore becomes an essential component of the strategy.
7. The Trade-Off Between Liquidity and Expected Value
One of the major challenges in sports betting is that the best value opportunities are not necessarily available when market liquidity is at its highest.
Imagine that a bookmaker opens a market at odds of:
2.20 (+120)
Our model estimates that the fair odds should be:
2.00 (+100)
This represents an attractive betting opportunity.
However, the maximum bet limit is only €200.
Several hours later, the maximum bet limit increases to €2,000.
But the available odds are now:
2.05 (+105)
Betting capacity has increased significantly, while the available value has decreased.
| Market timing | Decimal odds | American odds | Maximum bet | EV at a 50% probability |
|---|---|---|---|---|
| Opening | 2.20 | +120 | €200 | +10% |
| Several hours later | 2.10 | +110 | €1,000 | +5% |
| More mature market | 2.05 | +105 | €2,000 | +2.5% |
| Closing | 2.00 | +100 | €5,000 | 0% |
This illustrates a fundamental trade-off.
Should a bettor prioritize a higher Expected Value with a smaller stake or a lower Expected Value with a larger stake?
The answer depends on expected profitability, risk, bankroll size, and execution opportunities.
8. The Best Odds Do Not Always Generate the Highest Potential Profit
Let us return to the previous example.
A €200 stake with a 10% Expected Value generates an expected profit of:
€200 × 10% = €20
A €1,000 stake with a 5% Expected Value generates an expected profit of:
€1,000 × 5% = €50
A €2,000 stake with a 2.5% Expected Value also generates an expected profit of:
€2,000 × 2.5% = €50
| Stake | Expected Value | Expected profit |
|---|---|---|
| €200 | +10% | €20 |
| €1,000 | +5% | €50 |
| €2,000 | +2.5% | €50 |
The third bet has the same expected profit as the second, but it requires twice as much capital.
It also exposes the bettor to a larger potential loss.
Maximizing expected profit alone is therefore insufficient.
The amount of capital committed and the risk required to generate that profit must also be considered.
9. What Is Scalability in Sports Betting?
Scalability refers to a strategy's ability to increase its investment volume without excessively reducing its performance.
A scalable betting strategy allows more capital to be deployed while maintaining attractive profitability.
Consider two strategies.
Strategy A
ROI: +8%
Annual bets: 1,000
Average executable stake: €100
Strategy B
ROI: +4%
Annual bets: 1,000
Average executable stake: €1,000
| Indicator | Strategy A | Strategy B |
|---|---|---|
| ROI | +8% | +4% |
| Number of bets | 1,000 | 1,000 |
| Average stake | €100 | €1,000 |
| Betting turnover | €100,000 | €1,000,000 |
| Theoretical profit | €8,000 | €40,000 |
Strategy B has half the ROI of Strategy A.
However, its economic potential is five times greater in this example.
This explains why experienced sports betting investors do not simply look for strategies with the highest ROI.
They also look for strategies capable of absorbing their capital.
10. Why a Strategy That Is Profitable With €50 Stakes May Become Unprofitable With €1,000 Stakes
Imagine a strategy that primarily targets smaller leagues.
With €50 stakes, the bettor regularly obtains the desired odds.
The strategy has a historical ROI of 7%.
The bettor then decides to multiply the bankroll by 20 and increase the stake to €1,000.
Several problems may arise.
Some bets are rejected because the maximum bet limits are insufficient.
Others can only be placed at less favorable odds.
Certain opportunities disappear before the entire stake can be executed.
The bettor's own stakes may also contribute to price movements.
The result may be a significant reduction in profitability.
| Desired stake | Illustrative ROI after execution | Expected profit per bet |
|---|---|---|
| €50 | +7% | €3.50 |
| €100 | +6.5% | €6.50 |
| €250 | +5% | €12.50 |
| €500 | +3% | €15 |
| €1,000 | -1% | -€10 |
These figures represent an educational simulation.
They demonstrate that beyond a certain threshold, increasing stakes can become counterproductive.
A larger bankroll is only useful if the market allows it to be deployed under favorable conditions.
11. How Odds Movements Affect Profitability
Odds play a decisive role in the profitability of a betting strategy.
Even a small price movement can significantly reduce Expected Value.
Suppose our estimated true probability of an event is 50%.
| Decimal odds obtained | American odds | Expected Value |
|---|---|---|
| 2.20 | +120 | +10% |
| 2.15 | +115 | +7.5% |
| 2.10 | +110 | +5% |
| 2.05 | +105 | +2.5% |
| 2.02 | +102 | +1% |
| 2.00 | +100 | 0% |
| 1.98 | -102 | -1% |
| 1.95 | -105 | -2.5% |
A strategy that is initially profitable at odds of 2.10 (+110) may lose its entire theoretical edge if the odds fall to 2.00 (+100).
Below that price, the bet becomes theoretically unprofitable according to our probability estimate.
This is why bettors should not focus exclusively on the recommended selection.
The price at which a bet is executed is just as important as the selection itself.
12. What Is Slippage in Sports Betting?
Slippage refers to the difference between the odds at which a bettor intends to place a bet and the odds at which the bet is actually executed.
This concept is also widely used in financial markets.
Consider an example.
A Tipster publishes a bet at odds of:
2.10 (+110)
A client attempts to place the bet a few seconds later.
The available odds are now:
2.04 (+104)
The client has experienced unfavorable slippage of 0.06 in decimal odds.
If the estimated true probability is 50%, the consequences are as follows.
| Indicator | Tipster | Client |
|---|---|---|
| Decimal odds obtained | 2.10 | 2.04 |
| American odds | +110 | +104 |
| Estimated probability | 50% | 50% |
| Expected Value | +5% | +2% |
| Expected profit on €50 | €2.50 | €1 |
The client still has a positive Expected Value bet.
However, 60% of the original theoretical edge has disappeared.
Over hundreds or thousands of bets, this difference can fundamentally change the client's financial results.
13. Why a Few Seconds Can Make a Difference
In sports betting, an opportunity can disappear very quickly.
When odds are particularly attractive, several professional bettors may attempt to exploit the same opportunity simultaneously.
The first stakes may trigger a price adjustment.
Other bettors are then left with less favorable conditions.
Imagine the following situation.
A Tipster publishes a bet at 2.10 (+110).
The first clients obtain that price.
Others obtain 2.08 (+108).
The next clients obtain 2.04 (+104).
Finally, some clients can only obtain 2.00 (+100).
They are all following the same selection.
However, they are no longer following exactly the same economic strategy.
With a true probability of 50%, their Expected Values are 5%, 4%, 2%, and 0%, respectively.
Execution speed does not guarantee a particular price.
However, it can play an important role in preserving a strategy's statistical edge.
14. Liquidity and Closing Line Value (CLV)
Closing Line Value measures the quality of the odds obtained compared with the market's closing odds.
Suppose a Tipster obtains odds of 2.10 (+110).
The closing odds are 2.00 (+100).
The raw CLV, calculated using the ratio between the odds obtained and the closing odds, is:
(2.10 ÷ 2.00 - 1) × 100 = +5%
A client only obtains odds of 2.02 (+102).
The client's raw CLV is:
(2.02 ÷ 2.00 - 1) × 100 = +1%
| Indicator | Tipster | Client |
|---|---|---|
| Decimal odds obtained | 2.10 | 2.02 |
| Closing decimal odds | 2.00 | 2.00 |
| Raw CLV | +5% | +1% |
The Tipster and the client followed the same bet.
However, the quality of their execution was different.
A strategy can therefore display excellent historical CLV while becoming considerably less attractive to its followers if the original odds are no longer accessible.
It is also important to remember that raw CLV does not account for all changes in the bookmaker's margin.
Positive CLV is a valuable indicator, but it does not guarantee profitability.
15. Why a Tipster's Results Are Not Enough to Evaluate Investment Capacity
When investors analyze a Tipster, they generally examine several indicators.
ROI.
Number of bets.
Profit in units.
CLV.
Maximum Drawdown.
Consistency of performance.
All these indicators are important.
However, one question is often overlooked.
How many clients can actually follow this Tipster under comparable betting conditions?
A Tipster may generate an exceptional ROI in markets with very low maximum bet limits.
The Tipster's personal results may be entirely genuine.
However, if dozens or hundreds of clients attempt to place the same bets simultaneously, some of them may fail to obtain the original odds.
Two distinct qualities must therefore be considered.
The ability to identify profitable betting opportunities.
The ability to share those opportunities with a substantial number of investors without reducing their profitability.
An excellent Tipster does not necessarily have substantial collective investment capacity.
16. AVG BM (Avg max bet): An Essential Liquidity Indicator on Bet2invest
At Bet2invest, market liquidity is one of the important factors used to evaluate Tipsters.
AVG BM (Avg max bet) represents the average maximum stake offered by Pinnacle across a Tipster's recorded bets, measured when those bets are registered.
For each bet, the maximum stake available at Pinnacle provides information about the potential execution capacity of that particular opportunity.
Consider three individual bets.
| Bet | Maximum stake observed at Pinnacle |
|---|---|
| Bet A | $1,000 |
| Bet B | $5,000 |
| Bet C | $20,000 |
The third bet has a significantly higher maximum stake than the first.
This suggests potentially greater execution capacity.
By averaging these individual maximum stakes, Bet2invest's AVG BM provides an indication of the typical capacity of the markets used by a Tipster.
However, AVG BM must be interpreted correctly.
The maximum stake observed for an individual bet is a limit available at a particular moment, not a guaranteed pool of money reserved for all followers.
A series of bets may change the available odds or betting conditions.
AVG BM is therefore a valuable capacity indicator, but it does not guarantee that every client will be able to place a bet at the same price.
17. How Is AVG BM Calculated?
AVG BM helps investors understand the average maximum stake associated with a Tipster's bets.
Consider a simplified example.
A Tipster has placed five bets.
| Bet | Maximum stake observed at Pinnacle |
|---|---|
| Bet 1 | $2,000 |
| Bet 2 | $3,000 |
| Bet 3 | $5,000 |
| Bet 4 | $8,000 |
| Bet 5 | $7,000 |
The AVG BM is:
($2,000 + $3,000 + $5,000 + $8,000 + $7,000) ÷ 5 = $5,000
This indicator provides an initial overview of the average capacity of the markets exploited by the Tipster.
It helps distinguish a Tipster operating in relatively deep markets from one specializing in markets with lower betting capacity.
However, an average can conceal significant differences between individual bets.
18. Why AVG BM Alone Is Not Enough
Consider two Tipsters.
| Bet | Tipster A | Tipster B |
|---|---|---|
| Bet 1 | $5,000 | $500 |
| Bet 2 | $5,000 | $500 |
| Bet 3 | $5,000 | $500 |
| Bet 4 | $5,000 | $500 |
| Bet 5 | $5,000 | $23,000 |
| AVG BM | $5,000 | $5,000 |
Both Tipsters have exactly the same AVG BM.
However, their liquidity profiles are very different.
Tipster A operates with relatively consistent maximum bet limits.
Tipster B has limited capacity on four out of five bets.
The AVG BM is heavily influenced by a single bet with a very high maximum stake.
To evaluate investment capacity more accurately, it may therefore be useful to examine:
- The median maximum bet limit.
- The proportion of bets in low-liquidity markets.
- The most frequently observed maximum bet limits.
- The distribution of bets across leagues.
- Differences between main and secondary markets.
- Capacity available at the Tipster's usual publication times.
AVG BM is a useful indicator, but the distribution of individual maximum bet limits is equally important.
19. How Many Followers Can a Tipster Accommodate?
This question is fundamental for a professional sports betting marketplace.
Follower capacity depends on several factors, including market liquidity, individual client stakes, execution speed, and the market's reaction to incoming bets.
At Bet2invest, AVG BM can serve as an operational benchmark for evaluating this capacity.
The following table provides indicative guidelines.
| AVG BM | Indicative follower capacity |
|---|---|
| Approximately $1,000 | A few clients |
| Approximately $3,000 | Around 20 clients |
| Approximately $5,000 | Around 30 clients |
| Approximately $10,000 | Around 50 clients |
| $20,000 or more | Around 100 clients |
These figures are indicative operational benchmarks, not a universal formula or a capacity guarantee provided by Pinnacle.
Actual capacity depends particularly on the amounts wagered by individual followers.
Thirty clients betting €20 each do not create the same market pressure as thirty clients betting €500 each.
20. Why the Number of Followers Alone Cannot Measure Market Saturation
Imagine two groups of clients following the same Tipster.
Group A
30 followers.
Average stake: €20.
Total requested stakes per bet: €600.
Group B
30 followers.
Average stake: €500.
Total requested stakes per bet: €15,000.
| Indicator | Group A | Group B |
|---|---|---|
| Number of followers | 30 | 30 |
| Average stake | €20 | €500 |
| Total requested stakes per bet | €600 | €15,000 |
The number of clients is identical.
However, the second group generates 25 times more demand for betting capacity.
Managing a Tipster's capacity solely according to the number of subscribers would therefore be insufficient.
A more relevant approach is to consider total requested stakes alongside the capacity of the markets being exploited.
21. The Importance of Autobetting Capacity
Autobetting allows clients to automatically follow the bets of a Tipster or a betting strategy.
This technology can significantly improve execution.
It allows predetermined staking rules to be applied automatically and reduces delays associated with manual intervention.
However, automation does not eliminate liquidity constraints.
If a market cannot absorb all requested stakes under the desired conditions, execution speed alone may not be sufficient.
This is why Autobetting capacity is an essential component of marketplace management.
A responsible platform should seek to preserve the execution quality of existing clients when accepting new followers.
The objective should not simply be to maximize the number of subscriptions.
It should also be to preserve the conditions under which betting strategies can be followed.
22. Why Limiting a Tipster's Capacity Can Benefit Investors
Imagine a highly profitable Tipster operating in markets with moderate liquidity.
The Tipster has 30 clients.
Most of them obtain odds close to those originally published.
The Tipster continues to generate a positive ROI, and execution conditions remain satisfactory.
Now suppose the number of followers increases to 300 without any adjustment to capacity management.
Total demand for stakes increases significantly.
Odds may move more rapidly.
Some clients may experience execution difficulties.
The ROI actually achieved by followers may consequently decline.
Under these circumstances, temporarily restricting access for new clients can be a rational decision.
Available capacity is not simply a commercial consideration. It is an integral part of the quality of service provided to investors.
23. Why a Bookmaker That Welcomes Winning Bettors Still Imposes Maximum Bet Limits
Pinnacle is widely recognized for its sharp bookmaker model and its policy of welcoming winning bettors.
This represents an important advantage for professional sports bettors.
However, two concepts should not be confused.
Individual restrictions imposed on a bettor because of their performance.
Maximum bet limits applicable to a particular market.
A bookmaker can welcome winning bettors while still imposing a maximum stake on a specific selection.
Such limits help the bookmaker manage its risk exposure.
They may vary according to the sport, market, timing of the bet, and applicable conditions.
Being able to continue betting with a bookmaker despite profitable results does not mean that a bettor can place unlimited stakes.
This distinction is essential when evaluating the scalability of a betting strategy.
24. Sharp Bookmakers vs. Soft Bookmakers: A Fundamental Difference
Professional bettors generally distinguish between sharp bookmakers and soft bookmakers.
Sharp bookmakers typically focus on competitive markets and accommodate experienced bettors within their rules and market limits.
Soft bookmakers may be more likely to impose individual restrictions on certain bettor profiles.
| Characteristic | Sharp Bookmakers | Soft Bookmakers |
|---|---|---|
| Approach to winning bettors | Generally more welcoming | Individual restrictions may apply |
| Margins on main markets | Often competitive | Variable |
| Maximum bet limits | Primarily market-dependent | Market-dependent and sometimes strongly profile-dependent |
| Long-term scalability | Potentially greater | May be significantly restricted |
| Suitability for professional betting | High when conditions allow | Variable |
These are general distinctions, not absolute rules applicable to every bookmaker.
Nevertheless, stable access to betting markets is a major consideration for any strategy intended to be followed over the long term.
This is one of the reasons Bet2invest uses Pinnacle odds to certify the betting records of its Tipsters.
25. Theoretical Bankroll vs. Effectively Deployable Bankroll
A bettor may have a bankroll of €100,000.
However, this does not necessarily mean that the entire €100,000 can be deployed efficiently through a single betting strategy.
Imagine that the strategy operates in markets where stakes of €200 can regularly be placed, but larger stakes are rarely available under favorable conditions.
Using a 1% betting unit, the reference bankroll corresponding to this capacity is:
€200 ÷ 1% = €20,000
The bettor therefore has a total bankroll of €100,000, but this particular strategy can only accommodate a portion of that capital under the bettor's usual staking rule.
| Indicator | Amount |
|---|---|
| Total bankroll | €100,000 |
| Theoretical stake at 1% | €1,000 |
| Regularly executable stake | €200 |
| Reference bankroll at a 1% stake | €20,000 |
| Remaining capital available for allocation | €80,000 |
This does not mean that the remaining €80,000 is useless.
It can be held in reserve or allocated to other strategies.
However, calculating the profitability of this strategy as though €1,000 stakes were consistently executable would be misleading.
26. How to Estimate the Maximum Bankroll a Strategy Can Accommodate
An initial approach is to determine the average stake that can actually be executed under favorable conditions.
If one betting unit represents 1% of the allocated bankroll, the formula is:
Reference deployable bankroll = Executable stake ÷ 0.01
| Executable stake per bet | Reference bankroll at 1% |
|---|---|
| €50 | €5,000 |
| €100 | €10,000 |
| €250 | €25,000 |
| €500 | €50,000 |
| €1,000 | €100,000 |
| €2,000 | €200,000 |
| €5,000 | €500,000 |
This method provides an initial estimate.
However, it does not independently determine the optimal bankroll.
Maximum Drawdown, variance, simultaneous bets, correlations between selections, and available cash requirements must also be considered.
An executable stake of €1,000 does not automatically mean that a €100,000 bankroll is appropriate for the strategy's risk profile.
27. Market Liquidity vs. Bankroll Liquidity
There is another important distinction.
Market liquidity refers to the market's ability to absorb stakes.
Bankroll liquidity refers to the bettor's ability to access funds immediately to place new bets.
Imagine a bettor with a €5,000 bankroll.
The bettor has already committed €3,500 to unsettled bets.
The remaining available capital is:
€5,000 - €3,500 = €1,500
The bettor now wants to place several additional bets.
Even if those markets have very high maximum bet limits, immediate betting capacity is restricted by the funds already committed.
| Indicator | Amount |
|---|---|
| Total bankroll | €5,000 |
| Capital committed to unsettled bets | €3,500 |
| Immediately available funds | €1,500 |
A bettor must therefore manage two constraints simultaneously.
Available market capacity.
And the availability of personal betting capital.
28. Why a 1% Stake Does Not Mean Total Risk Is Limited to 1%
With a €5,000 bankroll, a €50 stake represents 1% of the initial capital.
However, if the bettor places 20 simultaneous bets, total exposure becomes:
20 × €50 = €1,000
This represents 20% of the bankroll.
With 50 simultaneous bets, total exposure becomes:
50 × €50 = €2,500
That represents 50% of the bankroll.
| Number of simultaneous bets | Stake per bet | Total exposure | Share of bankroll |
|---|---|---|---|
| 5 | €50 | €250 | 5% |
| 10 | €50 | €500 | 10% |
| 20 | €50 | €1,000 | 20% |
| 30 | €50 | €1,500 | 30% |
| 50 | €50 | €2,500 | 50% |
The betting unit is an individual staking rule.
It does not replace overall exposure management.
This distinction is particularly important when investors follow several Tipsters or betting strategies through Autobetting.
29. Diversification as a Solution to Liquidity Constraints
Suppose an investor has a bankroll of €50,000.
The investor wants to place €500 stakes.
However, the primary strategy operates in markets where €100 stakes are more readily executable.
Instead of forcing larger stakes through a single strategy, the investor could consider allocating capital across several strategies.
| Strategy | Allocated bankroll | 1U = 1% |
|---|---|---|
| Strategy A | €10,000 | €100 |
| Strategy B | €10,000 | €100 |
| Strategy C | €10,000 | €100 |
| Strategy D | €10,000 | €100 |
| Strategy E | €10,000 | €100 |
| Total | €50,000 |
Each strategy exploits its own betting opportunities.
The investor may therefore be able to deploy more capital without concentrating all stakes in the same markets.
Diversification may also help reduce certain risks.
However, it is only effective if the strategies are not excessively correlated.
30. Beware of False Diversification
Following five Tipsters does not necessarily mean that an investor has five independent strategies.
Imagine that all five Tipsters regularly publish bets in the same leagues.
They may select the same games.
They may also use closely related markets, such as Asian handicaps, point spreads, and totals.
In some cases, several bets may depend on the same sporting outcome or match scenario.
Apparent diversification may therefore conceal substantial concentration.
For example, an investor following three Tipsters who all recommend the same home team may end up placing three stakes on a single selection.
This simultaneously increases risk exposure and pressure on market liquidity.
Effective diversification should therefore consider:
- Sports.
- Leagues.
- Types of betting markets.
- Betting times.
- Overlapping selections.
- Correlations between strategies.
Diversifying Tipsters is not enough. Investors must also diversify their sources of risk and the markets they exploit.
31. Why Bet2invest's Strategy Builder Should Be Used With Capacity in Mind
Bet2invest's Strategy Builder allows users to create and analyze betting strategies using historical Pinnacle data.
For football, the available historical data covers up to 10 years.
For other sports, it covers up to 5 years.
Users can analyze strategies according to leagues, betting markets, odds ranges, and various statistical criteria.
A strategy may display a particularly attractive ROI during a backtest.
However, an additional question must be asked.
Can the bets identified by this strategy actually be executed today with the amounts I intend to invest?
A historical strategy with a 10% ROI may be less economically exploitable than a strategy with a 4% ROI if the first strategy operates in markets with very low maximum bet limits.
Liquidity should therefore form part of the economic analysis accompanying the backtest.
Historical odds allow users to evaluate theoretical profitability.
However, they do not independently guarantee that the desired stakes would have been accepted at those same prices.
32. Why Opening and Closing Odds Must Be Analyzed Differently
A strategy may display an 8% ROI at opening odds.
The same strategy may display a 2% ROI at closing odds.
This difference can be significant.
| Reference price | Illustrative historical ROI | Potential betting capacity |
|---|---|---|
| Opening odds | +8% | Often more limited |
| Intermediate odds | +5% | Variable |
| Closing odds | +2% | Potentially greater |
The investor must determine when the bets can actually be executed.
If a strategy relies on odds that are only available for a few seconds, its theoretical profitability may be difficult to reproduce.
Conversely, a strategy offering a lower Expected Value but accessible over a longer period and with higher maximum bet limits may be more suitable for a larger bankroll.
The best historical strategy is therefore not necessarily the best strategy in terms of real-world investment capacity.
33. Theoretical ROI vs. Achievable ROI
Imagine a strategy with the following historical performance.
Number of bets: 2,000.
ROI at reference odds: +6%.
Theoretical stake: €100.
Betting turnover: €200,000.
Theoretical profit: €12,000.
However, during real-world execution, the investor encounters several difficulties.
Some bets cannot be placed.
Others are executed at less favorable odds.
The average stake actually accepted is lower than expected.
The results become:
| Indicator | Backtest | Illustrative real-world execution |
|---|---|---|
| Number of bets | 2,000 | 1,800 |
| Average stake | €100 | €80 |
| Betting turnover | €200,000 | €144,000 |
| ROI | +6% | +4% |
| Profit | €12,000 | €5,760 |
The actual profit is less than half the theoretical profit.
This difference illustrates the importance of execution.
It is not enough for a strategy to be profitable in historical data.
It must also be reproducible under real market conditions.
34. Why Execution Rate Should Be Monitored
Execution rate represents the proportion of intended bets that are actually placed.
If a strategy generates 1,000 opportunities and the investor successfully executes 950 bets, the execution rate is:
950 ÷ 1,000 × 100 = 95%
This indicator is useful, but it is not sufficient.
The proportion of intended stake volume that is actually executed should also be measured.
Imagine that the investor wants to stake €100 on each of the 1,000 bets.
The intended betting turnover is €100,000.
In practice, the investor places 950 bets with an average stake of €80.
Actual betting turnover is:
950 × €80 = €76,000
The execution rate by stake volume is therefore:
€76,000 ÷ €100,000 × 100 = 76%
| Indicator | Result |
|---|---|
| Execution rate by number of bets | 95% |
| Execution rate by stake volume | 76% |
A high execution rate by number of bets can therefore conceal significantly lower investment capacity than expected.
35. How to Determine the Optimal Stake Size
An investor's objective should not be to place the maximum possible stake on every bet.
Instead, the objective should be to find a balance between expected profit, risk, and execution capacity.
Consider the following simulation.
| Average stake | Expected ROI after execution | Expected profit per bet |
|---|---|---|
| €50 | +6% | €3 |
| €100 | +5.8% | €5.80 |
| €250 | +5% | €12.50 |
| €500 | +4% | €20 |
| €750 | +2.5% | €18.75 |
| €1,000 | +1% | €10 |
| €1,500 | -0.5% | -€7.50 |
In this example, expected profit per bet is maximized with a €500 stake.
Increasing the stake beyond this level reduces expected profit.
The economically optimal stake is therefore not necessarily the maximum amount accepted by the bookmaker.
It represents a trade-off between stake size and the profitability that remains available.
Furthermore, once variance and Drawdown risk are taken into account, a stake below €500 may be preferable.
36. The Concept of Marginal Return
Marginal return measures what each additional euro invested contributes to expected profit.
Suppose an initial €100 stake can be placed at odds of 2.10 (+110).
The estimated true probability is 50%.
The Expected Value is 5%.
The expected profit is €5.
To place an additional €400, the bettor must accept odds of 2.02 (+102).
The Expected Value of this additional stake is 1%.
The additional expected profit is:
€400 × 1% = €4
Total expected profit is:
€5 + €4 = €9
| Stake portion | Decimal odds | American odds | EV | Expected profit |
|---|---|---|---|---|
| First €100 | 2.10 | +110 | +5% | €5 |
| Additional €400 | 2.02 | +102 | +1% | €4 |
| Total €500 | +1.8% | €9 |
Betting turnover has increased fivefold.
However, expected profit has only increased by a factor of 1.8.
Marginal return declines as execution conditions deteriorate.
This approach helps explain why profits do not always increase in proportion to bankroll size.
37. How to Evaluate a Tipster's Investment Capacity Before Subscribing
Before selecting a Tipster, investors can examine several complementary indicators.
1. Historical ROI
Provides information about observed profitability.
2. Number of bets
Helps evaluate the depth of the historical sample.
3. CLV
Provides information about the quality of the odds obtained.
4. AVG BM (Avg max bet)
Provides an indication of the average maximum stake available in the markets used by the Tipster.
5. Types of leagues
Help investors understand the structure of the betting opportunities.
6. Publication timing
Helps evaluate execution conditions.
7. Autobetting capacity
Provides information about the availability of automated following.
8. Intended stake sizes
Must be compatible with the actual execution conditions.
9. Costs
Must be incorporated into the calculation of net economic profit.
10. Maximum Drawdown
Helps evaluate whether the strategy is compatible with the investor's bankroll and risk tolerance.
These criteria allow investors to go beyond a simple comparison of ROI.
38. A Complete Example: Choosing Between Two Tipsters According to Bankroll Size
Consider two hypothetical Tipsters.
| Indicator | Tipster A | Tipster B |
|---|---|---|
| Historical ROI | +9% | +5% |
| Annual bets | 1,000 | 1,500 |
| CLV | Positive | Positive |
| AVG BM | $1,500 | $15,000 |
| Assumed executable individual stake | €50 | €500 |
An investor has a bankroll of €5,000.
The betting unit is €50.
Under these conditions, both Tipsters may be compatible with the bankroll, subject to actual execution capacity.
| Tipster | Annual betting turnover | Theoretical profit |
|---|---|---|
| A | €50,000 | €4,500 |
| B | €75,000 | €3,750 |
Tipster A offers the higher theoretical profit.
Now imagine that the investor has a bankroll of €50,000.
The desired stake is €500 per bet.
Under the assumed execution conditions, Tipster A can still only accommodate €50 per bet.
Tipster B can accommodate €500.
| Tipster | Executable stake | Annual betting turnover | Theoretical profit |
|---|---|---|---|
| A | €50 | €50,000 | €4,500 |
| B | €500 | €750,000 | €37,500 |
Tipster B becomes considerably more attractive in terms of economic potential.
Yet the historical ROI is lower.
These projections assume that historical performance can be reproduced and exclude additional costs.
They primarily demonstrate that the same Tipster may be suitable for a small bankroll but considerably less suitable for a larger one.
39. How to Increase Stakes Gradually Without Damaging a Strategy
When investors want to increase their bankroll or betting units, they can adopt a gradual approach.
Consider an initial stake of €50.
The first increase might bring the stake to €75.
Then to €100.
Next to €150.
And potentially to €200.
At each stage, the consequences of the increase should be analyzed.
| Indicator to monitor | Objective |
|---|---|
| Execution rate | Verify that betting opportunities remain accessible |
| Actual accepted stake | Measure effective betting capacity |
| Slippage | Monitor deterioration in the odds obtained |
| CLV | Evaluate the quality of executed prices |
| ROI | Monitor observed profitability |
| Maximum Drawdown | Assess changes in risk |
| Simultaneous exposure | Preserve available betting capital |
| Costs | Measure actual economic profitability |
It is important not to draw conclusions from only a few bets.
An increase in stakes may coincide with a period of negative variance without the strategy having lost its statistical edge.
Conversely, a winning streak does not prove that the new execution conditions are satisfactory.
The analysis should be based on a sufficiently large sample and distinguish sporting outcomes from the quality of the odds obtained.
40. The 12 Most Common Mistakes Regarding Bankroll and Liquidity
- Assuming that a larger bankroll automatically allows larger stakes in every market.
- Confusing a bookmaker's maximum bet limit with total market liquidity.
- Assuming that odds obtained with €50 stakes will always be available with €1,000 stakes.
- Comparing Tipsters solely according to their ROI.
- Ignoring AVG BM and the distribution of individual maximum bet limits.
- Treating a maximum bet limit as guaranteed collective capacity for all followers.
- Ignoring slippage between published odds and actually executed odds.
- Assuming that Autobetting eliminates all liquidity constraints.
- Increasing stakes without monitoring execution rates.
- Confusing Tipster diversification with genuine market diversification.
- Forgetting about capital already committed to unsettled bets.
- Treating backtested profitability as proof of profitability at scale.
Conclusion
Why can't you increase your stakes indefinitely in sports betting?
Because every market has a limited capacity to absorb stakes.
Because odds may change as betting amounts increase.
Because maximum bet limits vary according to sports, leagues, betting markets, and execution timing.
And most importantly, because a strategy that is profitable at a small scale does not necessarily maintain its profitability when more capital is deployed.
A strategy with a 5% ROI that can absorb substantial betting volume may offer greater economic potential than a strategy with a 15% ROI that is restricted to small stakes.
This is why professional betting strategy analysis should be based on several fundamental pillars.
ROI.
Number of bets.
Closing Line Value.
Bankroll management.
Maximum Drawdown.
Market liquidity.
And real-world execution capacity.
At Bet2invest, the combination of betting records certified using Pinnacle odds, CLV tracking, AVG BM, and Autobetting allows investors to go beyond simply analyzing a Tipster's historical results.
The objective is to better understand the conditions under which a strategy can be followed, the bankroll it can accommodate, and the scale at which it can potentially operate.
The Strategy Builder adds another dimension by allowing users to analyze betting strategies over extensive historical periods.
However, regardless of the quality of a Tipster or an algorithmic strategy, the same fundamental principle applies.
A strategy only has economic value to the extent that its statistical edge can be exploited under real market conditions.
True performance is therefore not simply about identifying profitable bets.
It is about identifying a sustainable edge, repeating it, protecting it, and deploying the amount of capital that the market can reasonably absorb.
This is the approach that gradually distinguishes casual bettors from professional sports bettors.
FAQ: Bankroll and Liquidity in Sports Betting
1. What is liquidity in sports betting?
Liquidity refers to a market's ability to absorb stakes without causing significant changes in odds or execution conditions.
2. Why is liquidity important for professional sports bettors?
Liquidity determines whether bettors can increase their stakes while maintaining competitive odds and a sufficient statistical edge.
3. Can you increase your bankroll indefinitely?
You can increase your available capital, but this does not mean that all of it can be efficiently deployed through a single betting strategy. Liquidity, risk, and execution capacity impose constraints.
4. Does Pinnacle impose maximum bet limits?
Yes. Although Pinnacle is recognized for welcoming winning bettors, maximum bet limits apply to individual betting markets. These limits may change according to market conditions.
5. What is AVG BM on Bet2invest?
AVG BM (Avg max bet) represents the average maximum stake offered by Pinnacle across a Tipster's recorded bets, measured when those bets are registered. It provides an indication of the typical betting capacity of the markets used by that Tipster.
6. Does AVG BM guarantee that all followers can place their bets at the same odds?
- AVG BM is an average capacity indicator. Actual execution depends on individual market limits, total requested stakes, price movements, and execution timing.
7. Is a Tipster with a higher ROI always more attractive?
- Investors should also consider the number of bets, CLV, Drawdown, liquidity, and the amounts that can actually be wagered under favorable conditions.
8. What is slippage in sports betting?
Slippage is the difference between the intended or published odds and the odds actually obtained when a bet is executed. Unfavorable slippage can reduce Expected Value and profitability.
9. Can Autobetting solve liquidity problems?
- Autobetting can improve execution speed and consistency, but it does not create additional market liquidity.
10. How can you determine whether a betting strategy is scalable?
You should evaluate whether larger stakes can be executed while maintaining competitive odds, satisfactory execution rates, sufficient profitability, and an acceptable level of risk.
11. Why can opening odds be more difficult to exploit with a large bankroll?
Maximum bet limits are often lower at market opening. Value opportunities may also disappear quickly as early bets trigger price adjustments.
12. How can you deploy more capital without saturating a market?
One possible approach is to allocate capital across genuinely diversified strategies that exploit different sports, leagues, markets, or betting times.
13. Is a profitable backtested strategy necessarily suitable for a large bankroll?
- Backtesting helps evaluate historical performance, but actual execution conditions, maximum bet limits, odds availability, and costs must also be considered.
14. What is the best indicator for measuring a Tipster's investment capacity?
There is no single definitive indicator. AVG BM, the distribution of maximum bet limits, follower stake sizes, slippage, and execution rates should be analyzed together.
15. What is the most important rule regarding bankroll and liquidity?
Do not simply aim to place the largest stake your bankroll allows. Aim to place the amount that is compatible with your statistical edge, risk management, and actual market conditions.